[Imported] Implementing health checks PT.2 - Azure Application Insights configuration
This post was originally published on Dev.to.
This is the second post in a series dedicated to health checks.
- Implementing health checks PT.1 - Asp.Net Core 6 configuration
- Implementing health checks PT.2 - Azure Application Insights configuration (this post)
Once the application is deployied, we may want to use some tool that periodically ping these endpoints and send us a notification when something is not properly working.
The tool I use most is Azure Application Insights.
Application Insights
Azure Application Insights is a wonderful service provided by Azure to monitor live apps. It provides tons of features, such as logs search and health checks ping as shown later, and it supports lot of languages - not just dotnet.
From official documentation:
Application Insights is a feature of Azure Monitor that provides extensible application performance management (APM) and monitoring for live web apps. Developers and DevOps professionals can use Application Insights to:
- Automatically detect performance anomalies.
- Help diagnose issues by using powerful analytics tools.
- See what users actually do with apps.
- Help continuously improve app performance and usability.
Application Insights:
- Supports a wide variety of platforms, including .NET, Node.js, Java, and Python.
- Works for apps hosted on-premises, hybrid, or on any public cloud.
- Integrates with DevOps processes.
- Has connection points to many development tools.
- Can monitor and analyze telemetry from mobile apps by integrating with Visual Studio App Center.
Configuring availability checks in Application Insights (AI)
To get started, create a new AI instance in your Azure subscription and navigate to the overview page:

In particular, there are three charts:
- Failed requests: shows the amount of requests that the application failed to process (4xx/5xx status codes)
- Server response time: average server response time
- Server requests: amount of requests per minute
- Availability: the server availability over time
Of course, to have some data from the first three charts you need to link this AI resource to an another Azure resource such as Azure WebApp, Azure Functions or Azure Kubernetes Service.
Instead, the availability data is obtained from the ping requests that AI does to an endpoint of your choice.
To setup them up, navigate to Availability section and click “Add Standard (preview) test”.

NB: the Standard test is still in preview but since it is only a ping service, I think it is safe enough to be used in production environments. It is not that different than the classic test but provides some additional options
Setup a name for the test, such as MyWebAppPingTest and the url to ping (in the previous post I did set health checks on routes like /alive and dbcontext, so I put <hostname>/alive or <hostname>/dbcontext).
Then there are several options that can be checked to enhance the accuracy of the test. Each of them is properly documentated by going hover the i icon with the mouse, so I don’t go deep for each of them. However, I want to focus on some area:
- you can set the HTTP Rest verb and eventually custom headers: it is useful when your resource is behind a gateway such as Azure API Management or you want to add some protection to your APIs.
- it is possible to set some custom successfull criteria by checking response status code, response body and other details that give you enough flexibility to play with different scenarios of your app
- the last section is about alerts, that can be configured only after the ping test creation. Enable it, we will use it in the next chapters
Click create and wait for the deploy.
Looking at availability results
After a while, data will start to be populated and a line in the chart is drawn:
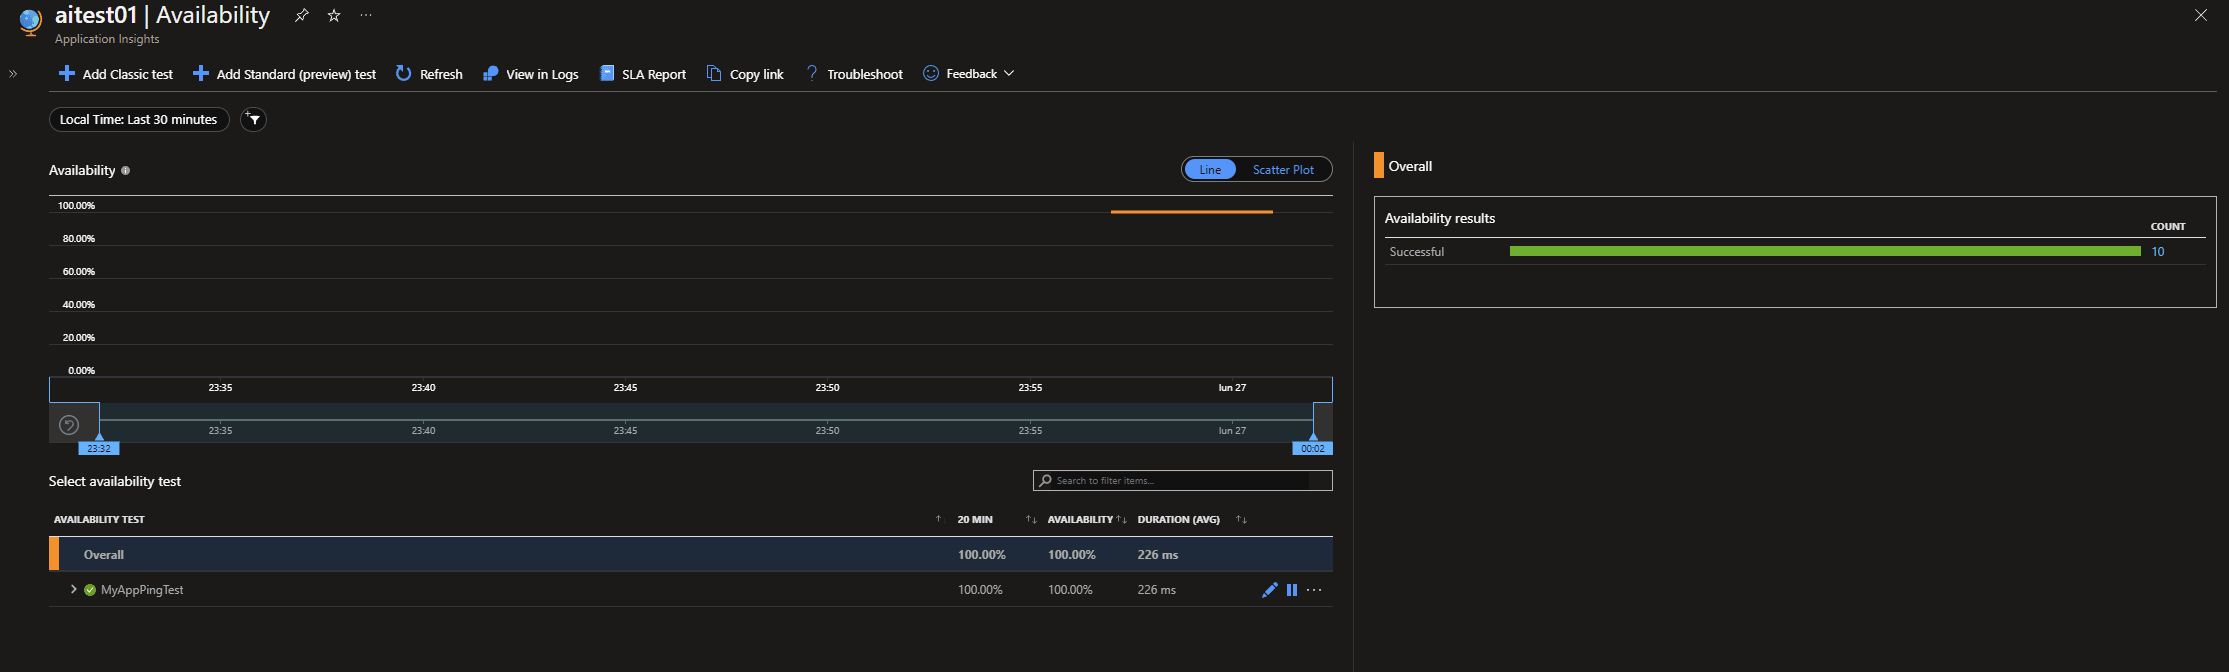
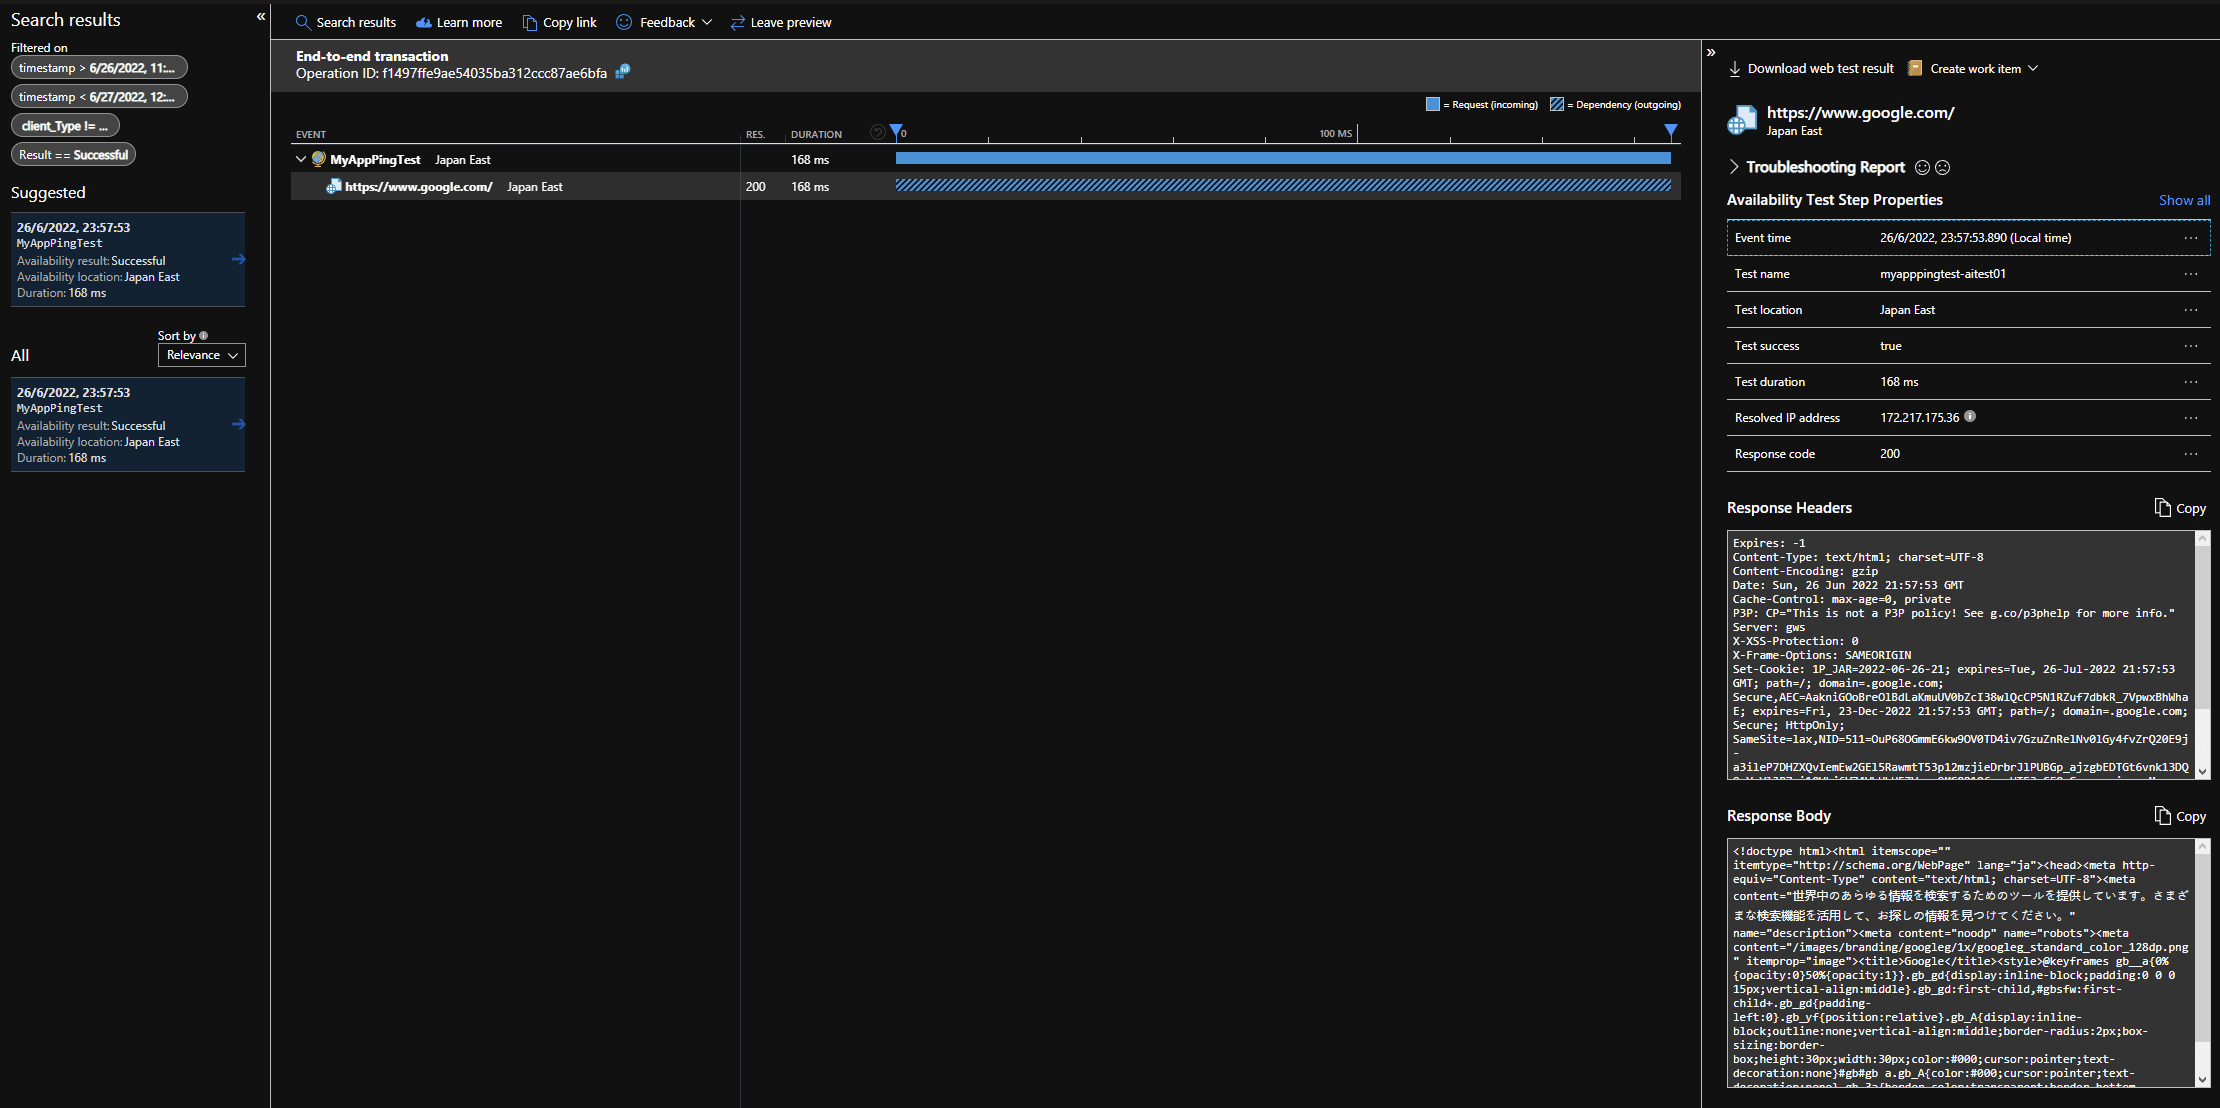
Clicking on a category result on the right hand side (such as Successful or Failed), a new pane opens showing the list of the ping requests in the selected category. By clicking on one of them, the trace of that request is shown:
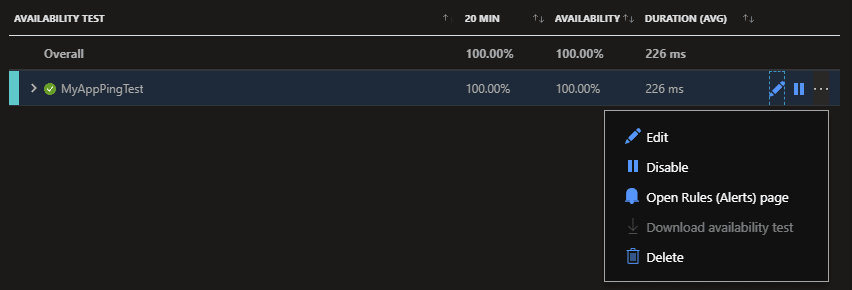
Going back to the Availability section, you can set alerting by selecting your ping test and clicking on the three dots menu Open Rules (Alerts) page:
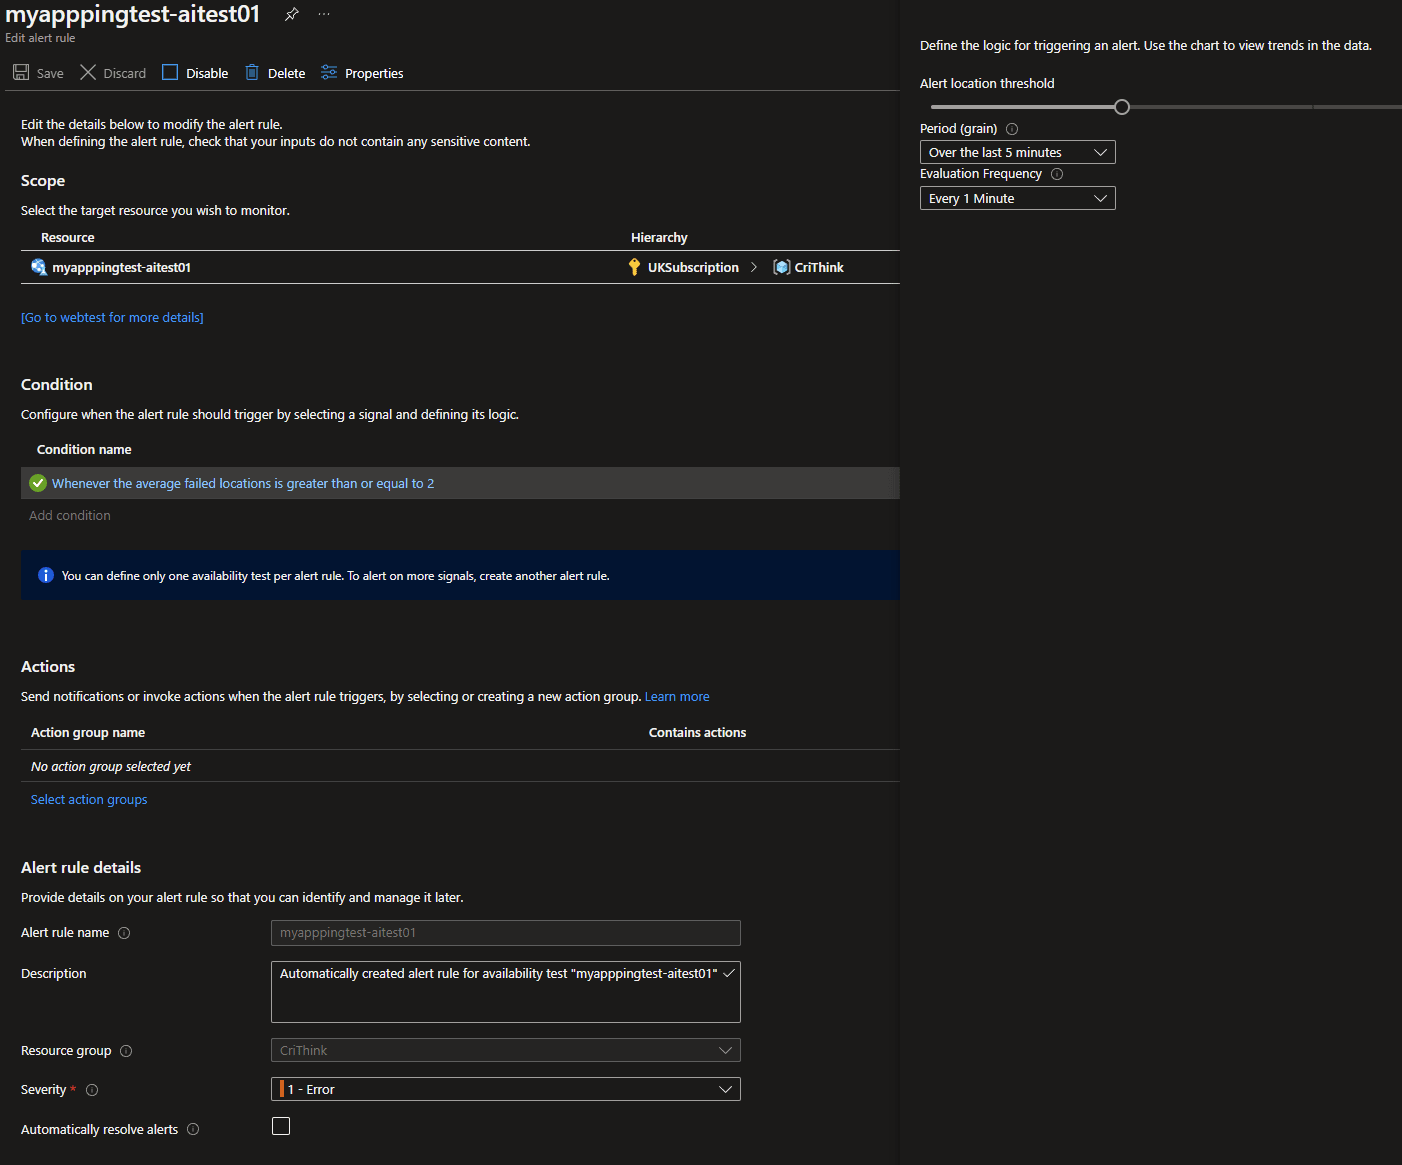
Here you are basically in Azure Monitor and you see the list of alert rules in your subscriptions. Selecting the previously created alert, a new page where you can customize alerting rules opens:
Conclusions
These two posts explain how to write health checks in your dotnet application using the dedicated SDK provided by Microsoft. Then, the second post shows the Azure Application Insights setup to ping and consume these endpoints in a real-like environment, with alerting support.
#Imported-Devto #Dotnet #Csharp #Tutorial #Devops